My apologies for my hiatus from blogging. Between training more than ever, working part-time, courting sponsors and maintaining a social life my bikes, it’s been a busy fall. After capping off the season in September, I decided to take several months off racing to take my training to the next level. Three months into my “off-season”, I’m confident that I could surpass any of last season’s performances and I’m laying plans for next year.
The theme of this two-part post is testing. Between late October and early November, I underwent more tests than I care to count—bike, blood, bone, body composition and heart. Some test results were encouraging and others were disappointing, and even alarming.
I am admittedly a data junkie; my training is data-driven, I work with data, and I collect a lot of personal data. I believe in better living (and racing) through data. Testing and measuring are the first step towards understanding and improving.
I share some personal stuff on this blog and this post is no exception. Not many pro triathletes will show you power test results, blood work or finances. I want to be totally open and approachable and share every detail of my adventures as a pro triathlete. Ask me anything—I’m yours!
Power testing
No one looks forward to fitness testing, but I absolutely dread it. I’d ideally be emotionally-detached and objective about testing. However, it can be difficult to invest so much in the sport without feeling like your self-worth is tied to the numbers that come out.
I used to entirely avoid fitness testing (outside of racing), but my coaches have helped me understand the value. Besides collecting data, testing is an opportunity to practice failure. In my 2014 recap, I identified the ability to push myself to failure as a weakness and set a goal of learning how to collapse across finish lines or blow up trying. I’ve decided that this is a mental illness skill acquired through practice.

I had three personal best tests on different days between November 4 to 14 (weight was ~72 kg):
- Maximal Aerobic Power (MAP) ramp test (Result: MAP = ~435 W)
- hold 435 W to failure (Result: 5 mins)
- 20 minute best effort (Result: 381 W)
The graph below shows my best 5 and 20 minute efforts each month since I got a power meter in August 2013.

I could devote an entire post to all the factors that contributed to that upwards trend. I described some of the factors in one of my most popular posts, The Polar Vortex is my Tailwind, but that post is sorely in need of an update. I outlined my bike training at the time, which was heavy on “sweet spot” intensity (~85-95% threshold). I plugged away with a long block of sweet spot from November 2013 to March 2014. I saw rapid gains at first, but improvement slowed and eventually plateaued. There is undoubtedly a time and place for sweet spot, but I don’t recommend drilling only that narrow intensity range for months.
Shortly after in May, David Tilbury-Davis of PhysFarm took over my bike/run coaching. Among many changes, the intensity distribution of my training became more polarized. In practice, this means lots of endurance (Zone 2) riding with key blocks of high intensity (Zone 5+), and more sparing use of tempo and threshold (Zone 3-4). I responded very well to these changes and saw a nearly instant jump in power in May, despite no significant change in training load.
Suddenly introducing high intensity training made for an interesting experiment because I completely shunned work above threshold in the past. Not surprisingly, I saw a huge increase in my short duration power. In fact, critical power modeling suggests that my anaerobic work capacity has more than doubled over the past 8 months. It was a rude shock to discover that racing at the pro level is far from steady state and it helps to have some pop.
Blood testing
Routine blood testing is commonly recommended for athletes, although there is some debate over its usefulness, especially for healthy athletes [e.g., 1,2,3]. I’ve had quite a few blood tests over the past several years. For me, regular blood testing has proven to be useful in a few cases, which I’ll touch on.
General practitioners may not understand how training can impact blood test results, or recognize the difference between optimal values for competitive athletes versus acceptable values for the general population. This is one reason that I started working with a sports doctor last spring. I track all my results in a spreadsheet because I like having this information at my fingertips.
Selected markers from my blood tests beginning in 2008 (age 18) to present (age 24) are below. Why am I sharing this? Because I know that some of you, like me, will find this interesting. I’ll present these results without much discussion since I can’t claim to be an expert, despite my incessant Googling.
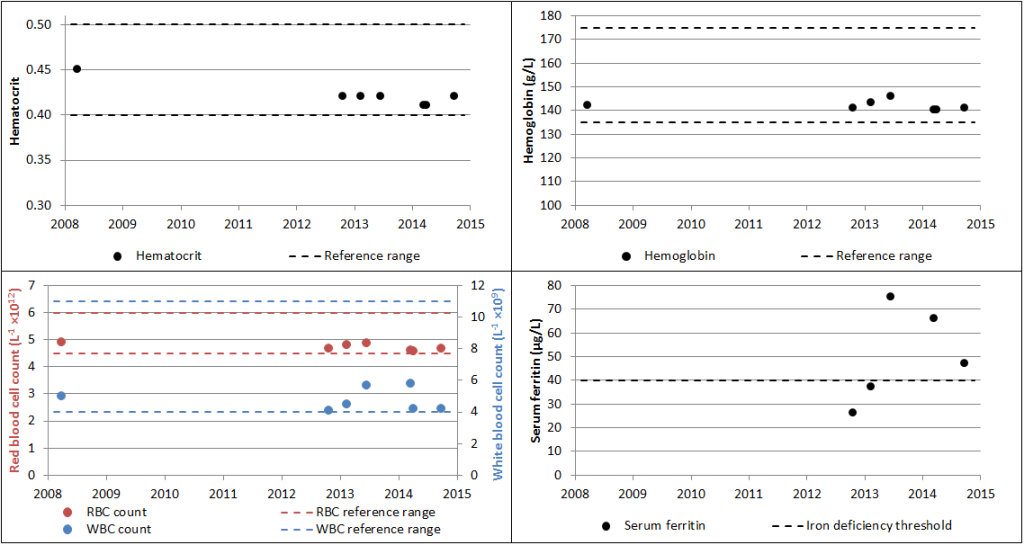 |
| Hematocrit, hemoglobin, red and white blood cell count, and serum ferritin. Serum ferritin (SF) is an indirect marker of iron stores. Definitions of iron deficiency vary from about SF <12-40 µg/L and iron supplementation is recommended for athletes below ~35 µg/L [1]. Iron supplementation can be beneficial for iron deficient non-anemic endurance athletes [2], and in some cases, even for athletes without clinical iron deficiency [3]. I have established through two years of trial and error that I need to supplement roughly 100 mg/day elemental iron to maintain SF >40 µg/L. |
 |
| Hormones: free testosterone, luteinizing hormone (LH) and follicle-stimulating hormone (FSH), thyroid-stimulating hormone (TSH), and morning cortisol. The red flag here is testosterone, which was the subject of a detailed two-part post earlier this year: How I Trashed My Testosterone and How I Triumphed Over Low Testosterone. With a comprehensive approach, I’ve managed to triple my free T levels and double LH levels since late 2012 (without resorting to prohibited substances). Even so, my T levels remain suboptimal. Improvement has been a long and painfully slow process, which is hopefully ongoing. |
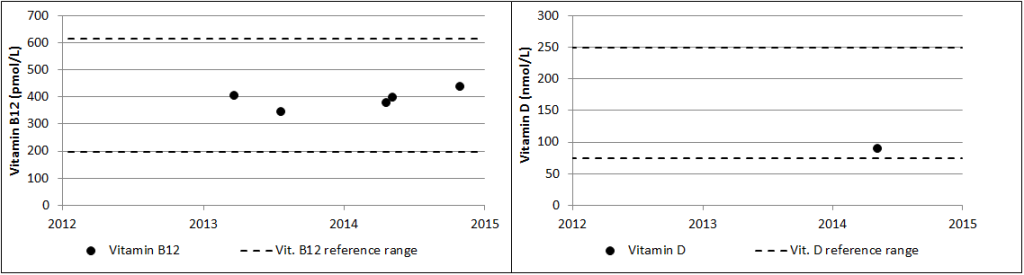 |
| Vitamin B12 and Vitamin D. As a vegetarian since 2008 (and lately a pescetarian), I’m often warned about vitamin B12 deficiency. My vitamin B12 levels are fine without supplementation. Optimal vitamin D levels are believed to be at least 75-100 nmol/L [1,2]. I don’t get much sunlight (training mostly indoors in Ontario), so I’ve been supplementing ~2000 IU/day. |
On a related note, I found out that I’m in the National Athlete Pool for the 2015 Canadian Anti-Doping Program. The prospect of my first doping test is strangely exciting. I’m imagining black helicopters swooping down in the dark of night, masked men in lab coats kicking down my door and extracting my blood at gunpoint. But if they’re hunting for a doper, my unimpressive hematocrit and testosterone levels will surely disappoint.
There are more personal test results and gratuitous data to come! Part II will be about my body composition and surprising discoveries about my bone density and heart.
I hope to get back to more regular blogging and tackle more #AskTriNerd questions. You can find nerdtastic tidbits and updates on my Facebook page. I also post some of my workouts on Strava.
Please join the conversation about this post on Facebook, Twitter or in the comments below.